Introduction
Shopping for a business intelligence platform in 2026 means sorting through overlapping feature lists and vague pricing pages. Grow.com positions itself as the no-code BI solution for teams that want real-time dashboards without hiring a data engineer — but does it actually deliver?
This review pulls from verified user feedback on Capterra (4.4/5 from 401 reviews) and G2 (4.3/5) to give you an honest read on Grow's strengths, its pricing process, and where it genuinely falls short. Whether you run a cannabis cultivation facility, a sales ops team, or a marketing department, this breakdown will help you decide before booking that demo.
Key Takeaways
- Grow is a no-code BI platform connecting 100+ data sources into real-time dashboards — built for non-technical business users
- Pricing is not public; you must request a trial or demo to receive a quote
- Users consistently highlight ease of use and customer support — but also note limited flexibility for industry-specific workflows
- Cannabis cultivators need purpose-built cultivation management software — Grow's general BI tools don't replace harvest scheduling, task management, or team accountability features
What Is Grow Analytics Software?
Grow.com is a no-code, full-stack business intelligence platform that pulls data from 100+ sources — SQL databases, Salesforce, Google Analytics, spreadsheets, cloud SaaS apps — into a single, centralized dashboard. The goal is to give non-technical teams the same data visibility that used to require a dedicated analyst or a data engineering hire.
Its primary audience is small to mid-sized businesses where go-to-market teams, operations managers, and business leaders need KPI visibility without waiting on IT. Grow sits between raw data sources and the decisions being made — it's a reporting and visualization layer. It doesn't manage operations or workflows; it surfaces data from tools that do.
Grow is a horizontal business intelligence (BI) tool — meaning it has no built-in understanding of any specific industry's operational logic. It connects to your existing tools and visualizes what's already there.
For teams with industry-specific needs, that's a real limitation. A cannabis cultivation operation, for example, needs more than a dashboard showing raw data — it needs scheduling logic, batch tracking, and workflow accountability built into the platform itself.
Grow's Key Features
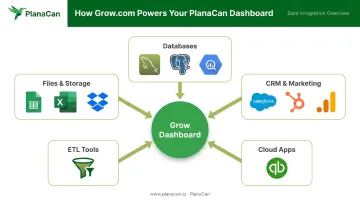
Data Integration and No-Code Preparation
Grow's connector library covers the most common business data sources:
- Databases: MySQL, SQL Server, Postgres, Redshift, BigQuery
- CRM and marketing: Salesforce, HubSpot, Google Analytics
- Files and storage: Google Sheets, Excel/CSV, Dropbox, Box, OneDrive
- Cloud apps: QuickBooks, and 100+ additional SaaS connectors
Beyond connecting sources, Grow includes inline ETL tools that let non-technical users clean, pivot, and filter data through a point-and-click interface. For users who need more control, SQL transforms run on PostgreSQL — so advanced logic is available without requiring a separate data prep tool.
Dashboards, Reporting, and Sharing
Once your data is connected and cleaned, Grow's drag-and-drop dashboard builder handles the visualization side — with chart types, KPI cards, and tables ready to configure.
Key capabilities include:
- TV Mode — displays live dashboards on office screens to keep teams aligned without everyone needing to log in
- Custom data refresh schedules — dashboards update automatically on set intervals (15-minute metric refresh, 1-hour dataset refresh) without manual intervention
- Grow advertises no per-seat charges, meaning any team member can access dashboards without adding to your subscription cost
- Mobile access — iOS and Android apps let users view dashboards from anywhere
- Read-only published links allow external sharing without requiring recipient accounts
Grow Pricing and Demo
Grow does not publish pricing. There is no public pricing page — G2's pricing section directs visitors to contact Grow directly, and the official Grow.com site surfaces "Request a Free Trial" and "Watch Demo" calls to action rather than any tier-based pricing table.
What third-party sources show:
- Capterra displays a third-party starting price signal of approximately $7.91/user, but Grow has not officially confirmed this figure
- Grow's homepage promotes unlimited users and no per-seat charges — pointing toward a flat-subscription model rather than per-seat pricing
The demo and trial process:
- Visit Grow.com and request a free trial or watch the demo
- Connect with the sales team to discuss your use case and receive a quote
- Trial access gives you hands-on time with core BI features before committing
That process works fine once you're ready to talk to sales — but if you need a ballpark number for internal budget approval first, Grow gives you nothing to work with. Buyers who want to self-qualify before a vendor call will need to factor in the extra steps.
Grow Pros, Cons, and User Reviews
Pros Based on Verified User Reviews
Ease of Use
This is Grow's most consistent praise point. A verified G2 reviewer summarized it well: "The UI is easy to use, the data transformation tools are great if you aren't proficient with SQL, and the support team is helpful and responsive." Non-technical users regularly report being able to connect data sources and build working dashboards without needing IT help.
Capterra reviews echo this sentiment: "Grow has been a reliable and easy to use business intelligence solution." For SMBs without dedicated data teams, that accessibility is the core value proposition.
Customer Support
Accurate Reviews rates Grow's support at 9.5/10 — one of the higher scores in the BI category. G2 reviewers back this up consistently: "The customer support is one of the best in industry" and "customer support has been excellent" appear across multiple review pages. Responsiveness and availability are the most cited qualities.
Multi-Source Data Connectivity
Users specifically call out how practical the data consolidation is. CRM data, marketing metrics, and financial figures land in one place without needing a data engineer to build pipelines first. For businesses juggling five or six disconnected tools, that matters.
At a Glance: Grow's Strengths
- Beginner-friendly UI with no SQL required for standard use cases
- Support rated 9.5/10 by Accurate Reviews — among the highest in BI
- Consolidates multi-source data without custom engineering work
Cons Based on Verified User Reviews
Advanced Customization Limits
Teams with complex or niche reporting requirements can hit a ceiling. Grow's no-code interface handles standard BI use cases well, but highly specialized transformations or integrations that don't fit the connector library require SQL workarounds. For users who aren't comfortable with PostgreSQL, that ceiling becomes a blocker.
Opaque Pricing
Grow's pricing model scores 7/10 on Accurate Reviews — lower than its support score. Buyers who want to evaluate cost before talking to sales will find this frustrating. G2 simply tells visitors to contact the company, and the official website offers no pricing reference point. For procurement-heavy organizations or teams with tight budget timelines, this creates unnecessary friction.
Who Is Grow Best For — and Where It Falls Short
Best-Fit Use Cases for Grow
Grow works well for:
- SMBs with fragmented data across CRM, marketing, and finance tools who need a unified view
- Non-technical leadership teams wanting live KPI dashboards without waiting on IT
- Go-to-market teams tracking pipeline metrics, marketing performance, and revenue data in one place
- Organizations building a data culture without the budget for a full data engineering team
One G2 snippet noted that Grow's flexibility makes it suitable for both small teams and larger environments, so it's not strictly limited to micro-businesses. That said, teams with highly complex analytical workloads or deeply specialized data requirements will likely find enterprise-grade platforms like Looker or Sisense offer more horsepower.
Where Grow Falls Short for Cannabis Cultivators
Cannabis cultivation teams searching for "grow analytics software" may land on Grow.com — but the platform wasn't built for what commercial growers actually need.
The analytics requirements in a cultivation facility look nothing like a SaaS company's KPI dashboard:
- Grow-schedule visibility across multiple flower rooms running staggered cycles
- Harvest cycle planning with phase-day-specific task cadence (pre-veg, veg, flower, harvest, dry, cure)
- Strain and treatment workflow templates that execute consistently across every harvest
- Team accountability tools that push daily task assignments to cultivators on the grow floor
Grow.com can visualize data that already exists in your other tools. It cannot create the operational structure cannabis cultivation requires.
That's the gap PlanaCan was built for. The platform serves commercial cannabis operations from 3,000 sqft single-room grows to multi-state operators managing 20,000+ sqft facilities across 11+ states. Where Grow.com provides a reporting layer on top of existing data sources, PlanaCan provides the operational infrastructure itself:
- View every harvest across all rooms simultaneously with an interactive Gantt chart
- Build custom workflow templates per strain, per treatment, and per cultivation step — deploy across every harvest cycle
- Send automated daily push alerts and emails so cultivators know their assignments without logging into a dashboard
- Execute task management on the grow floor via iOS and Android mobile apps
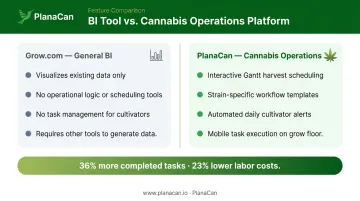
Garden First Cannabis, managing 16 rotating harvests simultaneously, achieved a 36% increase in completed tasks and a 23% decrease in labor costs using PlanaCan. A horizontal BI tool surfaces historical data. A purpose-built cultivation platform changes the numbers going forward.
Frequently Asked Questions
What is Grow analytics software?
Grow (Grow.com) is a no-code business intelligence platform that connects data from 100+ sources and visualizes it in real-time, customizable dashboards. It's designed for non-technical business users at small to mid-sized companies who want KPI visibility without writing code or hiring a data analyst.
How much does Grow analytics software cost?
Grow does not publicly list pricing. It uses a custom subscription model, and prospective customers must request a demo or trial to receive a quote. Grow's homepage does advertise unlimited users with no per-seat charges, suggesting a flat-subscription structure rather than per-user pricing.
Does Grow offer a free demo or trial?
Yes. Grow offers a free trial and demo on request through their website, giving teams access to core BI features before committing to a purchase.
What are the main pros and cons of Grow?
Pros include ease of use for non-technical teams, strong customer support (9.5/10 on Accurate Reviews), and solid multi-source data connectivity. Cons: limited advanced customization for complex use cases, and no publicly listed pricing, which requires engaging sales before self-evaluation is possible.
Is Grow easy to use for non-technical teams?
Yes — ease of use is Grow's most consistently praised attribute across Capterra and G2 reviews. Non-technical users routinely report connecting data sources and building dashboards without any SQL knowledge.
Is Grow a good fit for cannabis cultivation operations?
No. Cannabis cultivation teams need purpose-built scheduling, workflow automation, and team task management — not just KPI dashboards. PlanaCan is built specifically for commercial grow operations, covering perpetual harvest scheduling, cultivator notifications, and labor analytics that a general BI tool like Grow doesn't provide.