That era is ending. U.S. regulated cannabis sales reached $31.6 billion in 2025 and are projected to hit $39.1 billion by 2029, while wholesale flower prices hit a historic low of $888/lb in early 2025. More competition, more regulatory scrutiny, thinner margins — operations that can't identify and fix inefficiencies quickly are being squeezed out.
Data analytics isn't a tech upgrade for cannabis businesses. It's the shift from running a craft to running infrastructure. This article covers which areas of the cannabis business benefit most from analytics, which KPIs cultivators should track, and how to take a practical first step without overhauling your operation overnight.
Key Takeaways
- Tracking operational KPIs — yield per square foot, task completion rates, labor hours per pound — connects daily decisions to measurable business outcomes
- Centralizing scheduling and task data helps commercial grows cut waste, lower labor costs, and repeat their best harvests
- Cultivation records that are timestamped and attributed make compliance documentation audit-ready by default
- Predictive analytics tools are becoming accessible to mid-size operations, not just enterprise MSOs
- Building consistent data collection habits around the right metrics matters more than the technology itself
Why Data Analytics Is a Game-Changer for Cannabis Right Now
Why Cannabis Operations Can't Afford to Ignore Data Analytics Anymore
The cannabis industry is hitting a maturation point that most industries reach eventually: early growth that rewarded volume is giving way to a competitive environment that rewards efficiency.
Several structural factors explain why cannabis has lagged behind other industries in data adoption:
- Fragmented regulation — licensing, reporting, and compliance requirements vary by state, making standardized data infrastructure hard to justify early on
- Banking limitations — restricted access to financial services slowed investment in operational technology
- Volume-over-efficiency culture — during high-demand, high-price years, growing more mattered more than growing smarter
- Grower instinct as default — a workforce built on tacit knowledge, not documented process
Those barriers kept data adoption on the back burner — but the external pressure to catch up is arriving fast. The DOJ's proposed rule to reschedule marijuana from Schedule I to Schedule III, published May 2024, signals increasing federal oversight ahead. Institutional investors and multi-state operators already demand audit-ready data before they commit capital. State regulators in California, Michigan, Colorado, and elsewhere impose fines up to $5,000 per violation for licensed operations that fall short on compliance documentation.
What "Data Analytics" Actually Means in a Cultivation Context
Three distinct layers matter here:
- Raw data collection — sensor readings, task logs, harvest records, inventory counts
- Business intelligence — reporting on what already happened (last cycle's yield, last month's labor spend)
- Predictive analytics — using historical patterns to forecast what's likely to happen next
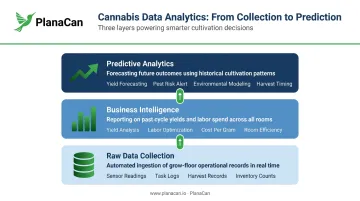
Most cannabis operations are still early in layer one. Operations that progress through all three layers will have a measurable edge — lower cost-per-gram, faster cycle times, and the documentation institutional capital requires.
The Key Areas Data Analytics Is Already Transforming Cannabis
Cultivation Operations
For indoor and greenhouse cultivators, real-time environmental data is where analytics delivers the most immediate value. Temperature, humidity, VPD, CO₂, and light intensity readings allow growers to catch problems before they damage crops rather than responding after the fact.
Peer-reviewed research found Cannabis sativa performs efficiently at 25–30°C and approximately 1,500 µmol m⁻² s⁻¹ PPFD, and a 2025 study confirmed that elevated humidity outside optimal VPD thresholds significantly reduced biomass and cannabinoid outcomes. Continuously monitoring these variables puts that science into daily operational practice.
Key parameters driving this monitoring include:
- Temperature — maintained at 25–30°C for peak metabolic efficiency
- VPD — kept within strain-specific thresholds to protect biomass and cannabinoid yield
- CO₂ and light intensity — tracked against PPFD targets to confirm photosynthetic efficiency
Beyond real-time control, analyzing environmental data across multiple grow cycles reveals which settings consistently produce superior results for specific strains. That knowledge becomes part of the operation's institutional record, not tied to any individual grower's memory or tenure.
Supply Chain and Inventory
Seed-to-sale traceability is mandatory across licensed markets. States like Michigan use Metrc, Washington uses Leaf Data Systems, and the list of mandated platforms continues to expand. But compliance reporting and supply chain optimization are different things.
When properly analyzed, inventory data helps operations avoid two costly failure modes:
- Overstocking — product aging in storage, accumulating carrying costs and degradation risk
- Stockouts — unfilled orders, missed sales windows, retailer relationship damage
Predictive demand signals from retail partners, when shared upstream, allow cultivators to align harvest timing with actual sell-through rates rather than guesses about market appetite.
Sales, Consumer Behavior, and Product Portfolio
Dispensaries and vertically integrated operators increasingly use POS analytics to evaluate SKUs by margin, velocity, and customer segment. Pre-rolls generated more than $4.1 billion in sales over 18 months covering 2023 and the first half of 2024, a format signal that should flow upstream to cultivation planning decisions about which strains to prioritize.
When retail data informs cultivation decisions, planting schedules and strain selection reflect what consumers are already buying — removing the guesswork from what to grow next.
Cultivation KPIs Every Commercial Grower Should Be Tracking
Most commercial grows generate plenty of raw data — sensor logs, compliance records, harvest weights — but raw data doesn't improve yields. The gap is in organizing that data into metrics tied to specific outcomes: throughput, margin, and labor efficiency.
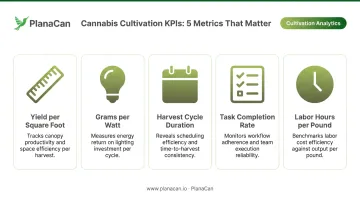
The most actionable cultivation KPIs are:
| KPI | What It Reveals |
|---|---|
| Yield per square foot of canopy | Overall space utilization and cultivation efficiency |
| Grams per watt of lighting energy | Energy cost relative to output — Cannabis Business Times cites ~2.5 g/W as a reference point |
| Harvest cycle duration | Time from clone/seed to harvest; longer cycles compress throughput |
| Task completion rate | Percentage of scheduled tasks completed on time; reveals SOP adherence gaps |
| Labor hours per pound of dried flower | True labor cost relative to output quality |
Where Workflow Data Fits In
KPIs don't measure themselves. The data behind them comes from scheduled, tracked workflows — and that's where most operations have the largest gap.
When every feeding, training, IPM treatment, and harvest task is scheduled in advance and tracked at completion, managers can pinpoint exactly where delays occur. They can see which team members need support and whether SOPs are being executed consistently across rooms and cycles.
This is the problem PlanaCan addresses directly. Built specifically for commercial cannabis grows, PlanaCan lets teams schedule every cultivation task, track completion in real time, and build custom templates for each strain and treatment protocol. The platform captures timestamped task records — who completed what, when, on which batch — generating the structured operational data needed to measure and improve performance across harvests.
Garden First Cannabis, a PlanaCan customer managing 16 rotating harvests, achieved a 36% increase in completed tasks and a 23% decrease in labor costs after implementing the platform. Both results came from the same root change: giving managers a clear, timestamped record of what was actually happening in the grow versus what was scheduled.
The Value of Comparing Across Cycles
Results like Garden First's become easier to reproduce once you can measure them consistently — and that requires comparing KPI performance across multiple harvest cycles, not just a single run.
A single cycle's yield numbers tell you what happened. Trend data across four or six cycles tells you whether your process changes are actually working — or just adding complexity without improving outcomes.
Predictive Analytics and Yield Optimization
Predictive analytics, in plain terms, uses historical cultivation data combined with statistical modeling to forecast future outcomes: projected yield for a current crop, estimated harvest date, or likelihood of a quality issue based on current environmental readings.
Machine learning is beginning to enter commercial cannabis platforms. A 2025 peer-reviewed study applied ML to multi-trait genomic prediction for cannabis breeding traits, and the broader controlled-environment agriculture space is already using AI-driven recommendations for irrigation, feeding, and climate control. Most commercial cannabis platforms are still building toward full ML integration, but the infrastructure is taking shape.
For mid-size grows without enterprise analytics budgets, the near-term opportunity is simpler: trend analysis of yield-per-sqft data across consecutive harvests. That analysis doesn't require data science expertise. It requires consistent data collection and a platform that surfaces comparisons in an accessible format.
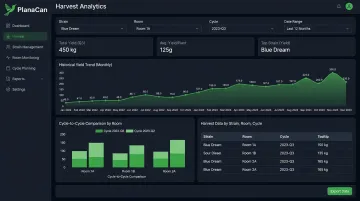
PlanaCan's harvest analytics dashboard tracks yield outcomes per strain, room, and cycle, with historical trend visualization designed to support continuous improvement. It's not ML-driven prediction — it's structured cycle-to-cycle comparison that gives cultivators the evidence they need to justify protocol changes to ownership and stakeholders.
The practical ceiling matters here too. A 2025 study found that osmotic-stress crop steering reduced plant height but also reduced yield in some conditions — meaning a technique that boosts one metric can quietly suppress another. Tracking both variables across cycles is the only reliable way to catch that before it costs you a harvest.
Compliance and Regulatory Readiness Through Data
In a regulated industry, analytics serves two purposes at once: it sharpens daily operations and satisfies regulators. Centralized, timestamped cultivation records form the backbone of audit-ready compliance documentation.
As federal rescheduling progresses, FDA-style oversight and Good Manufacturing Practice (GMP) expectations are moving closer to reality. No final federal cannabis cultivation GMP rule has been enacted yet, but the direction is set. Operations that already capture organized operational data will adapt faster when standards tighten.
What Audit-Ready Operational Records Look Like
PlanaCan's compliance role is worth clarifying precisely. It functions as the operations compliance layer — the documentation infrastructure that sits alongside seed-to-sale reporting. State track-and-trace systems (Metrc, BioTrack, Leaf Data Systems) handle plant-level inventory reporting. PlanaCan captures the operational documentation those systems don't: timestamped records of who executed which SOP, when, on which batch, along with environmental data, feed records, and IPM applications.
During a regulatory inspection, that per-batch operations log answers two questions regulators expect: "How do you do this?" (version-controlled SOPs) and "Can you prove it was actually done?" (timestamped task completion records with user attribution).
How to Build a Data Strategy for Your Cannabis Grow
The most common mistake is trying to track everything at once. The result is data chaos — inconsistent records across multiple tools, product names that don't match across systems, and no clear line between what was collected and what decisions it should inform.
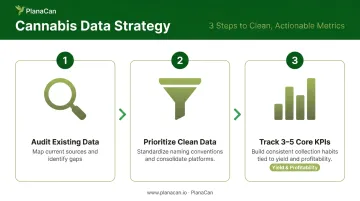
A more practical approach:
Step 1: Audit what you're already collecting. Map current data sources — even informal ones like spreadsheets and whiteboard schedules — and identify the gaps between what you track and what decisions you actually need to make.
Step 2: Prioritize clean data over more data. Inconsistent naming conventions, siloed systems (one tool for compliance, another for scheduling, another for financials), and informal recordkeeping make analysis nearly impossible. Standardizing collection habits and consolidating into fewer integrated platforms is a prerequisite.
Step 3: Start with three to five KPIs directly tied to yield and profitability. Build consistent collection habits around those metrics. Review trends monthly before adding complexity.
For small-to-mid-size grows, a cultivation management platform that captures scheduling and task execution data is the lowest-friction starting point — no data science expertise required, quick to integrate into daily workflows, and generating actionable metrics from the first harvest cycle forward. The goal is to build a data culture incrementally, where each harvest adds to an institutional knowledge base that makes the next cycle more predictable, more efficient, and easier to defend in an audit.
Frequently Asked Questions
What is a common KPI for cannabis cultivators?
Yield per square foot of canopy, harvest cycle duration, and task completion rate are among the most widely used. Yield per sqft measures space utilization; cycle duration affects throughput; task completion rate reveals whether SOPs are actually being followed by the team.
What is the cannabis data set?
It's the structured and unstructured data generated across the grow operation — cultivation logs, environmental sensor readings, nutrient schedules, state track-and-trace records, and harvest outcomes. The analytical value comes from connecting these layers, not from any single source alone.
What technology is used in the cannabis industry?
Major categories include cultivation management software, seed-to-sale tracking systems (Metrc, BioTrack, Leaf Data Systems), environmental sensors and IoT devices, and analytics tools. The current trend is toward integration across these categories so data flows between systems rather than living in separate silos.
How does data analytics help cannabis cultivators increase yields?
Analytics identifies which environmental conditions, nutrient protocols, and scheduling practices consistently produce the best yields for specific strains. That insight lets cultivators replicate top-performing harvests and reduce the variability caused by informal or memory-based processes.
What is the difference between business intelligence and data analytics in cannabis?
Business intelligence reports on what already happened: last quarter's yield, last month's labor costs. Data analytics goes further — it identifies why outcomes occurred and forecasts what's likely to happen next, enabling more proactive decisions before problems compound.
How can a mid-size cannabis grow start using data analytics without a large tech budget?
Start with a cultivation management platform that captures operational scheduling and task data. No data science expertise required. Platforms like PlanaCan integrate into daily workflows quickly and generate actionable performance metrics from the first harvest cycle, with a free trial period before any subscription commitment.