The stakes are real. US legal cannabis sales hit $30.1 billion in 2024, according to a City of Los Angeles Department of Cannabis Regulation summary citing Whitney Economics. With that much money moving through a fragmented, state-by-state market, guessing isn't a strategy anymore. This guide breaks down the top insights platforms serving dispensaries, brands, MSOs, and cultivators today.
TL;DR
- Cannabis insights software turns POS, menu, and market data into sales trends, pricing benchmarks, and consumer reports
- Dispensaries, brands, MSOs, and cultivators need different data scopes: retail, wholesale, or operational
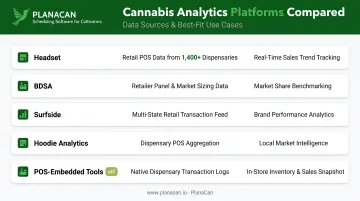
- Headset, BDSA, Surfside, Hoodie Analytics, and POS-embedded tools (Cova, IndicaOnline) lead the market
- Fragmented state legalization and cash-heavy operations create real data blind spots
- Cultivators often need operational analytics (yield, labor) with market data—platforms like PlanaCan cover that gap
What Is Cannabis Insights Software?
Cannabis insights software pulls data from point-of-sale systems, retailer menus, and consumer transactions to surface sales trends, pricing benchmarks, and category performance. Headset, for example, aggregates and anonymizes data from participating retailer POS systems and uses machine learning to normalize product data into a standard view.
This is different from seed-to-sale or compliance ERP software. Insights platforms answer business questions: what's selling, at what price, and to whom. Compliance systems like METRC or BioTrack answer regulatory questions: chain of custody, tax reporting, diversion prevention.
Why Third-Party Benchmarking Matters
The US cannabis market is legally fragmented. As of mid-2025, 24 states, three territories, and DC allow adult non-medical use, while 41 states allow medical use. Every state runs its own licensing, taxation, and reporting rules.
That fragmentation means:
- No single government dataset shows national trends
- No cross-market performance view for MSOs without third-party normalization
- No reliable "market" benchmark unless a vendor has already stitched the data
The platforms below are the leading options currently serving US cannabis retailers, brands, and MSOs.
Top Cannabis Insights and Analytics Software
Selection here comes down to four things:
- Data coverage
- Reporting speed
- Retailer and brand adoption
- Integration with systems you already run
Headset
Founded in 2015, Headset is one of the longest-standing data intelligence providers in cannabis. It reports direct connections to 3,500+ retailers across the US and Canada, tracking more than $1 billion in cannabis sales monthly.
Its Insights product covers shopping behavior, pricing, and best sellers, while Retail Pulse brings that intelligence directly into store-level decision-making.
| Best For | Data Sources | Notable Feature |
|---|---|---|
| Brands and MSOs needing cross-retailer benchmarking | Direct POS integrations across 3,500+ retailers | Retail Pulse for in-store analytics |
BDSA (BDS Analytics)
BDSA positions itself as a market-intelligence provider for retailers, manufacturers, brands, and investors. It pulls daily transaction data from more than 1,000 cannabis retailers and covers 450 verified brand houses.
BDSA's strength is benchmarking — velocity, distribution reach, discount lift, and share-of-shelf data that show exactly which products are gaining or losing ground.
| Best For | Data Sources | Notable Feature |
|---|---|---|
| Brands tracking category shifts and competitive positioning | Daily transaction feeds from 1,000+ retailers | SKU-level velocity and %ACV distribution reach |
Surfside
Surfside launched in 2019 and has grown into a full-stack platform connecting brands, retailers, and shoppers. It's less about raw market benchmarking and more about tying ad campaigns to actual sales, with a customer data platform built in.
It integrates with POS and ERP systems dispensaries already run, so analytics don't require ripping out existing workflows.
| Best For | Data Sources | Notable Feature |
|---|---|---|
| Brands running retail media campaigns | POS-connected first-party customer data | Campaign-to-sales attribution tools |
Hoodie Analytics
Hoodie's 2023 launch announcement claimed three billion daily observations across 10,000+ stores and nearly 10 million monthly customer store visits. Its differentiator is hyper-local competitive tracking — daily menu scans and real-time pricing comparisons against nearby dispensaries.
| Best For | Data Sources | Notable Feature |
|---|---|---|
| Dispensaries reacting to local competitor pricing | Daily menu scans plus retail POS/ERP partnerships | Real-time nearby-competitor price comparisons |
Cova Insights / IndicaOnline Reporting (Retail-Embedded Analytics)
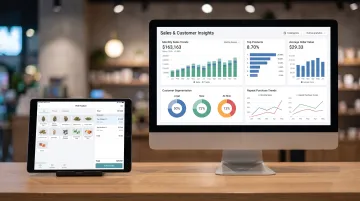
Some operators don't need a separate market-intelligence subscription — they need better reporting from the POS system they already run. Cova and IndicaOnline both offer native analytics suites: real-time mobile reporting, customer insights, and custom exports.
Because these tools live inside the POS, there's no separate integration to manage.
| Best For | Data Sources | Notable Feature |
|---|---|---|
| Single-location or small-chain dispensaries | Native POS transaction data | Zero-integration embedded reporting |
Cannabis Industry Data Challenges Worth Knowing
Even the best platforms run into structural problems that no dashboard can fully fix.
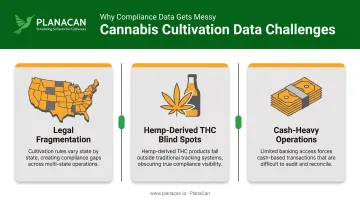
- Legal fragmentation: State-by-state legalization means data can't be pooled nationally without heavy normalization. A multi-state operator comparing California to Michigan is comparing two different regulatory universes.
- Hemp-derived THC blind spots: The 2018 Farm Bill legalized hemp below 0.3% THC federally, enabling hemp-derived THC beverages sold outside dispensary channels. Those sales rarely appear in tracked market data, leaving a gap when benchmarking the broader cannabinoid market.
- Cash-heavy operations: Many state-licensed cannabis businesses still run largely on cash due to limited banking access. That can distort reconciliation between reported sales and actual revenue. Treat analytics as one input, not the final word on financial performance.
How to Choose the Right Insights Platform for Your Business
The most common mistake? Picking a platform because it's well-known, not because it matches your actual data needs.
Before you commit, evaluate:
- Data scope — retail, wholesale, or cultivation-level? A brand needs different data than a dispensary chain
- Data freshness — daily updates versus real-time versus a two-to-three-month lag (yes, some providers still run that slow)
- Integration fit — does it connect with your existing POS, ERP, or cultivation systems without duplicate data entry?
- Geographic coverage — confirm which states are actually included, not just implied by a "national" label
When Cultivation Needs Different Data Entirely
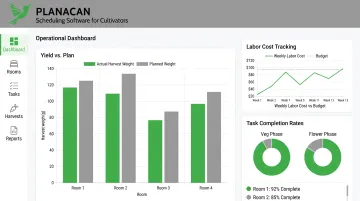
Retailers and brands need market intelligence. Cultivators need something else: yield tracking, labor cost per plant, task completion rates, and scheduling data across rooms and phases.
PlanaCan is built for that operational layer. It's a grower-first cultivation management platform, not a market analytics tool. It tracks:
- Yield by strain, room, and cultivation cycle, including yield-versus-plan comparisons
- Labor hours and cost by individual user, task, and cultivation phase
- Task completion by phase day, room, team, and user, with real-time escalation for missed work
One customer, Garden First Cannabis, reported a 36% increase in completed tasks and a 23% decrease in labor costs while managing 16 rotating harvests using PlanaCan. Market insights tell you what to grow and where demand is moving; cultivation ops data tells you whether your rooms, labor, and schedules can deliver it.
Conclusion
There's no single "best" cannabis analytics tool. The right choice depends entirely on where your business sits in the supply chain and what decision the data needs to inform.
Match the tool to the job:
- Brands chasing category share: BDSA or Headset
- Dispensaries reacting to local pricing: Hoodie
- Cultivators fixing labor waste and missed tasks: operational software, not a retail dashboard
Before committing to any platform long-term, run a pilot against your own sales or menu data first. Numbers on a sales page mean less than seeing how a tool handles your store, state, and categories.
If you're a cultivator looking to pair market insights with real operational control over scheduling and yield, PlanaCan's cultivation management platform is worth a look. Start with a free discovery call and a flexible trial sized to your team.
Frequently Asked Questions
How much does data analytics cost?
Pricing varies widely by data scope and business size, often ranging from a few hundred to several thousand dollars monthly. Most providers use custom quotes based on store count or data volume rather than published pricing.
How much money do dispensaries make a day?
Daily revenue varies heavily by state, location, and store size, with no single reliable national benchmark. Analytics tools help operators compare their own performance against local or regional averages instead.
What's the difference between cannabis insights software and seed-to-sale tracking?
Insights software focuses on market and sales intelligence for business decisions. Seed-to-sale software, like METRC or BioTrack, is built for regulatory compliance tracking from plant to sale.
Can small dispensaries afford cannabis analytics tools?
Yes. Many providers offer tiered pricing or POS-embedded reporting suited to single-location stores, not just enterprise chains with dozens of locations.
How often is cannabis market data updated?
Top platforms typically refresh menu and sales data daily or in real time, though depth and lag vary by provider. Always confirm the actual refresh schedule before buying.
Do cultivators need market analytics software too?
Cultivators generally benefit more from operational analytics on yield, labor, and scheduling than from retail market data. PlanaCan covers that operational layer without duplicating compliance or retail systems.