Introduction
Running a commercial cannabis cultivation operation has never been more competitive. Active U.S. cultivation licenses have dropped 24% since Q3 2023, a loss of more than 5,000 permits — and the operators still standing are fighting for margin in a market where wholesale prices continue to compress.
Most conversations about cannabis data analytics focus on the retail side: POS data, customer trends, dispensary foot traffic. For cultivators, the competitive edge is inside the grow — not at the register. Cycle times, yield per batch, labor efficiency, room-by-room performance: these are the numbers that determine whether your operation scales or stalls.
If you're not tracking them, someone else is.
Key Takeaways
- Data analytics for cultivators means acting on grow-specific performance data — not just sales figures
- Actionable data drives yield improvements, reduces wasted labor hours, and supports confident decisions across multiple rooms
- Without consistent data, replicating successful harvests and reducing waste relies on memory and assumption
- Standardized workflows must come first: analytics can only work with consistent, reliable execution data
What Is Data Analytics for Cannabis Cultivation?
For commercial cultivators, data analytics means collecting, organizing, and reviewing operational data from your grow — batch yields, cycle durations, task completion rates, resource inputs — to identify patterns and make better decisions.
In practice, it applies across:
- Environmental data — temperature, humidity, VPD, pH, and EC logged at each grow stage
- Harvest cycle tracking — yields by strain, room, batch, and grower across successive cycles
- Labor management — task completion rates, hours per cultivation phase, and individual team performance
- Strain performance — which varieties deliver the best return under your specific conditions
- Multi-room and multi-site visibility — consolidated performance data across your entire footprint
The real value is in answering the questions that drive your business: Why did this batch underperform? What would it take to replicate your best harvest? Without consistent data collection across these areas, those questions stay unanswered — and the same problems repeat cycle after cycle.
Key Advantages of Data Analytics for Cannabis Cultivators
The advantages below focus on measurable operational outcomes: yield, labor cost, cycle efficiency, and the ability to replicate and scale what works.
Advantage 1: Yield and Harvest Cycle Optimization
Data analytics allows cultivators to compare harvest performance across batches, strains, rooms, and time periods — surfacing which environmental conditions, treatment protocols, or cycle lengths consistently produce the best results.
In practice, this means recording inputs (nutrients, lighting schedules, environmental conditions) alongside outputs (wet weight, dry weight, overall yield) to build a performance baseline. That baseline reveals which variables drive yield and which introduce inconsistency.
The commercial yield gap is substantial. A 2025 Cannabis Business Times and Fluence survey found that 77% of commercial cultivator respondents averaged 50+ grams per square foot, while 57% averaged 80+ grams per square foot — a wide distribution that reflects how much execution variance exists across operations, even with similar inputs.
Without a performance record, grow decisions rely on memory and informal notes. With one, cultivators can identify the exact conditions that produced their top-performing harvests and deliberately replicate them. A cultivator who can answer "which strain delivers the best grams per square foot in our environment" makes procurement, scheduling, and capacity decisions with real confidence.
Platforms like PlanaCan support this by tracking yields per strain, room, batch, and cycle through a dedicated harvest analytics dashboard — and by letting growers encode top-performing protocols into reusable templates that can be deployed across subsequent cycles.
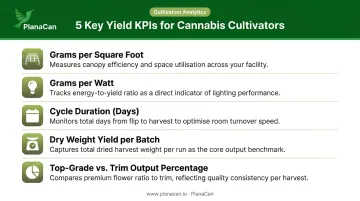
KPIs impacted:
- Grams per square foot
- Grams per watt
- Cycle duration (days from clone to harvest)
- Dry weight yield per batch
- Percentage of top-grade versus trim output
When this matters most: Expanding to additional rooms or a second facility, introducing new strains, or troubleshooting repeated underperformance that seems inconsistent across cycles.
Advantage 2: Labor Efficiency and Workflow Accountability
In a commercial grow with 5–20 team members, it's difficult to know whether daily tasks are being completed on schedule, where time is being lost, and what labor is actually costing per pound of output — without data.
As MJBizDaily notes, scaling from a small grow to commercial production requires moving from individual grower intuition to standardized business systems. Success with 100 plants doesn't automatically transfer to 10,000.
When workflows are standardized and tracked — scheduled tasks, completion timestamps, team assignments — cultivators can measure task completion rates, identify bottlenecks in the cultivation calendar, and calculate true labor cost at each stage.
That's where a platform like PlanaCan comes in: replacing informal task management with a structured, trackable system so labor efficiency metrics emerge automatically from daily work.
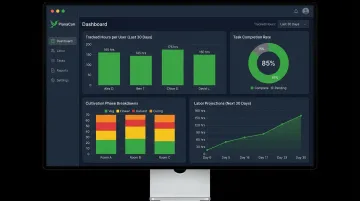
PlanaCan's labor dashboard tracks hours per user, task, phase, room, strain, and batch. It also generates forward-looking labor projections based on historical phase-day data — so cultivation directors can plan staffing for upcoming cycles rather than reacting to gaps after they appear.
Garden First Cannabis, a PlanaCan customer, achieved a 23% decrease in labor costs and a 36% increase in completed tasks after implementing the platform across 16 rotating harvests.
KPIs impacted:
- Tasks completed per cycle
- Labor cost per pound
- Hours per grow stage
- Missed task rate
- Labor cost as a percentage of total production cost
When this matters most: Scaling from a single room to multiple rooms, onboarding new team members, or managing a multi-site operation where a head grower can't be physically present in every location at once.
Advantage 3: Scalable Decision-Making Across Rooms and Sites
Optimizing labor gets you efficiency within a single operation. But once you add rooms, sites, and staff, a different challenge takes over: decisions made on instinct at small scale become high-risk at large scale.
Data analytics gives multi-room and MSO cultivators a consolidated view of performance across every active harvest cycle. It enables apples-to-apples comparisons between rooms, identifies which facility or grow lead is delivering the most consistent results, and surfaces systemic issues before they affect multiple sites.
MJBizDaily's reporting on MSO market exits highlights a consistent theme: expansion without operational standardization leads to disproportionate costs and inconsistent results across sites. Without centralized performance data, each new room or location essentially starts from scratch — repeating mistakes that could have been identified and corrected earlier.
PlanaCan addresses this directly through its "create once, deploy anywhere" template architecture. Proven protocols built at one site roll out across the entire MSO footprint automatically, ensuring standardized execution regardless of geography. The interactive Gantt chart gives cultivation directors a real-time view of every active harvest cycle across all rooms and sites simultaneously.
Data allows operators to answer questions like "Is this site ready to add a second flower room?" or "Why is Room 3 consistently underperforming Room 1?" — with evidence rather than assumption.
KPIs impacted:
- Yield consistency across rooms and sites
- Cycle time variance by location
- Labor cost per pound by site
- Task completion rate by team or room
- Overall canopy utilization
When this matters most: MSOs and enterprise cultivators managing over 20,000 sqft of canopy, or any operator adding a second location and needing to transfer what works without transferring the inefficiencies.
What Happens When Cannabis Cultivators Ignore Data
Running a commercial grow without structured data collection creates a compounding set of operational problems:
- Same strain, same room, different yield — and no record of what changed to explain it
- Reactive decision-making — problems surface after they've already affected a batch, not before
- Headcount changes and workflow investments become hard to justify without baseline performance data to point to
- Scaling blind — without performance benchmarks from existing rooms, expanding to new sites means accepting uncertainty and repeating avoidable mistakes
The longer a cultivation operation runs without consistent data collection, the harder it becomes to establish a reliable baseline. The absence of data today makes it harder to implement analytics later — not easier. A performance record can only be built one harvest cycle at a time, which means the cost of waiting compounds with every batch that goes untracked.
How to Get the Most Value from Cultivation Data Analytics
Analytics only delivers value when the underlying data is consistent. That requires standardizing workflows, grow protocols, and task structures before they can be meaningfully tracked.
Three principles make analytics actionable:
Standardize first, then analyze. A cultivation management platform like PlanaCan builds that foundation by creating repeatable templates for every treatment, strain, and cultivation stage — so data collected each cycle is comparable across time.
Integrate data collection into daily operations. Teams that log performance as part of their regular workflow — scheduling, task completion, harvest recording — generate better data with less friction than those attempting retrospective data entry. Mobile execution via iOS and Android apps makes this practical on the grow floor.
Act on insights after every cycle. Review cycle performance after each harvest, compare outcomes against benchmarks, and use findings to update grow protocols. Without that feedback loop, data collection becomes record-keeping rather than a driver of change.
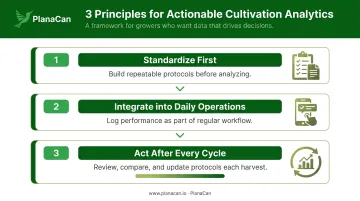
Growers who build data review into their standard operating rhythm — after every harvest, not once a quarter — are the ones who see incremental yield and efficiency gains stack up cycle after cycle.
Conclusion
Data analytics for cannabis cultivators delivers on three fronts:
- Visibility into what's actually happening in the grow, room by room
- Consistency in how work is performed and recorded across your team
- Confidence in decisions about what to change — or keep — next cycle
The advantages compound. Cultivators who build a performance record across multiple cycles gain a competitive edge that's hard to replicate quickly — particularly as they scale to new rooms or sites. Each harvest generates data that makes the next one more predictable.
Treat analytics as an ongoing cultivation practice, not a technology project. The platform is just infrastructure. PlanaCan is built for exactly that — giving commercial grow teams the scheduling, tracking, and analytics tools to put this into practice from day one. The value compounds every time you harvest.
Frequently Asked Questions
What are the 4 types of data analytics?
The four types are descriptive (what happened), diagnostic (why it happened), predictive (what will happen), and prescriptive (what should be done). In cultivation: descriptive shows last cycle's yield per square foot, diagnostic explains why one room outperformed another, predictive flags a batch trending below benchmark, and prescriptive recommends protocol adjustments.
What is a KPI in cannabis?
A KPI (Key Performance Indicator) is a measurable metric used to evaluate operational performance. In cultivation, common KPIs include yield per square foot, labor cost per pound, cycle completion rate, and task completion rate — each tied directly to grow efficiency or profitability.
What data should cannabis cultivators track?
The most impactful cultivation data points are harvest yield by batch and strain, cycle duration, task completion rates, labor hours per grow stage, and key environmental inputs like pH and EC. Consistent, standardized recording matters as much as what you track — without it, comparisons across cycles are unreliable.
How does data analytics help cannabis cultivators scale to multiple sites?
Centralized performance data lets MSOs and multi-room operators compare results across locations, replicate proven protocols, and identify site-specific issues before they compound. Expansion decisions become evidence-based rather than assumption-based — reducing the risk of transferring inefficiencies alongside best practices.
How can a small cannabis cultivation operation start using data analytics?
Start by standardizing workflows and recording basic cycle-level data — yield, duration, key task completion — consistently across harvests. The foundation for analytics is operational consistency, not sophisticated software; once execution is standardized, patterns become visible and actionable.
What is the difference between descriptive and predictive analytics in cannabis cultivation?
Descriptive analytics tells you what already happened — for example, last harvest yielded X grams per square foot. Predictive analytics uses that historical data to forecast whether a current batch is on track to hit that benchmark, based on cycle conditions so far.